July 15 2024 at 04:00AM
KPIs and metrics for successful projects
How many projects fail? What are the main causes for project failure?
Such questions were researched in the last decade, especially in relation to IT and software projects, considering the Agile revolution for the way of working and the shift of companies’ strategies on priority of digital transformations and digital products.
In a survey conducted by Boston Consulting Group on 403 global businesses across 25 industries in 2023, almost half of the respondents confirmed that more than 30% of the technology projects are having delays and budget overruns (Palumbo et al., 2024).
Similar findings were brought to light in the PMI report Pulse of Profession from 2023, where it has been shown that 40% of the projects which are not placing priority on power skills experience scope creep, hence not performing according to business needs and initial expectations.
In an earlier study conducted by BCG in 2020, it was revealed the fact that only 30% of the digital transformations achieve their objectives (Forth et al., 2020).
Bringing in more evidence on the failure of projects from various industries, in earlier statistics run by McKinsey and University of Oxford in 2012-2013, after having reviewed more than 5400 projects, it was shown the percentage of failing projects (large IT projects specifically defined at budgets exceeding $15 millions) was at a staggering level of 50%, with 45% of projects running over budget, while majority of the projects were delivering only 56% of the planned benefits (Bloch et al., 2013).
So considering the negative consequences created by failed projects, especially cost overruns comparable to GDPs of European countries, the phenomenon of research on what constitute major hurdles faced by companies to keep projects on track, has been drawing more attention.
The list of the identified challenges can be grouped into a handful of themes, as summarized below:
- lack of talent, lack of support from senior and executive management, old corporate cultures not adapted to current challenges (Andriole, 2021)
- lack of shared vision, misaligned priority requirements, unclear responsibilities, weak governance, inefficient processes, not following best practices and standards, not integrating security solutions, forgetting to include the maintenance and operations for the production phase of the project, confusing Agile approach with lack of rigour and quality (Davies & Di Pietro, 2022)
- expectations are not based on data, but rather on consensus at the level of executives, the “why” question is not clearly explained to the teams who need to undertake the projects so the management fails to have the buy-in from employees, poor execution of projects (Garcia, 2022)
- management is choosing the wrong project which is yielding little value and few wanted outcomes, unrealistic constraints, lack of effective leadership, complexity in terms of the number of business units and departments, commonly being geographically distributed, involved in the project delivery (Wu & Misra, 2023).
While the alignment between technical and business teams is crucial for the project success, there is a rather surprising discovery made by BCG that the Agile approaches to IT projects are not necessarily yielding to the desired results and the correlation between the project methodology and the success of projects and programs is non existent (Palumbo et.al., 2024).
Hence the focus should be on matching the business needs with the current capabilities of technical teams, understanding the gap in skills and the problems which companies are trying to solve by implementing new products and defining new Key performance indicators and metrics to keep the projects aligned to the desired goals.
In this article I will explore a series of KPIs and metrics which should provide better control mechanisms, monitoring features and alignment of projects with the expected value for the end customer or user.
In the recent years, especially for teams using different Agile frameworks, the velocity of teams represented a KPI to measure the amount of work completed within a finite time interval, but considering the current challenges of cross-collaboration and scaling up of organizations, velocity is not the most efficient KPI to determine the success of a project.
While it may still be useful in assessing the capacity of a team to handle work items, velocity is easily impacted by external factors such as change in the requirements, priorities or vision of the product, different way of working for various cross-functional teams contributing to the same project goal. It may also indicate that the team is performing according to the plan, being busy turning backlog items into working product, while in fact the team may miss valuable outcomes.
Evidence based management
To address these drawbacks and to help businesses build a wider perspective on capabilities versus demand and market trends, the framework proposed by Scrum.org referred to as Evidence based management, maintains the Agile practices, but expands at the level of organization and strategy, providing visibility on how organizations can achieve short-term, intermediate-term and long-term goals.
The framework is built around 4 dimensions which are supposed to guide the organizations in reaching their goals, balancing their actions between market value and organizational capability, hence maintaining their projects on track.
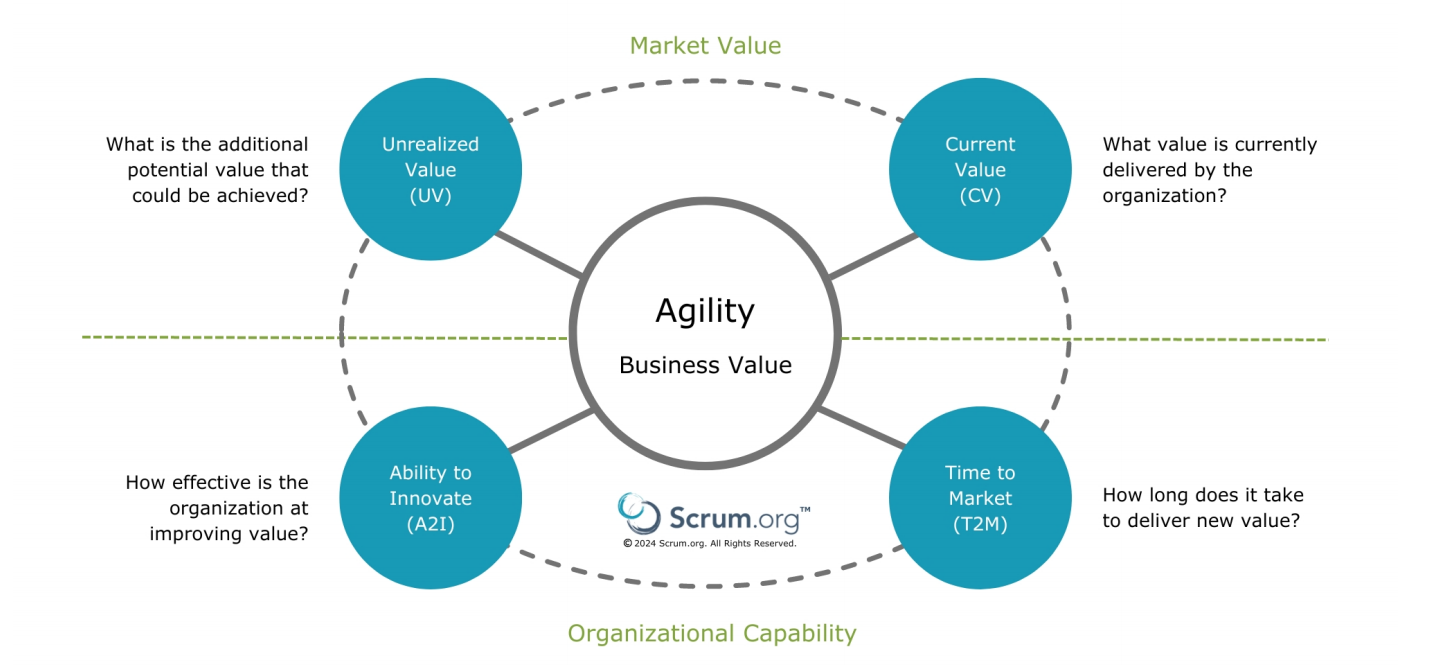
Source of picture: Evidence based management Guide, page 8, Scrum.org
One of the 2 KPIs concerning market value is the current value which is measuring the exact market value delivered in the present, taking into account the satisfaction of customers/users, but also of employees.
The second KPI related to market value is the unrealized value which is quantifying the progress made by organizations towards their long-term objectives, the difference between meeting current and future needs of customers. The unrealized value is also related to the risks and possible investments the organizations need to take in order to sustain the achievement of objectives.
Referring to organizational capability, one KPIs is the ability to innovate which is linking the capabilities of organizations with the innovative approaches for delivering value to their customers. This puts the organization into a new perspective to inspect their capabilities, adapt and improve for achieving those strategic objectives.
The second KPI measuring the organizational capability is the time to market which is measuring the time needed for organizations to deliver new solutions, while presenting their customers with value. The objective is to reduce the time to market by adapting the received feedback, incorporating new technologies and testing new products in a robust way.
Building on Agile principles such as inspection and adaptation, organization can use this framework to maintain momentum for their projects, monitor, control and minimize any possible disadvantages associated with budget overruns, delays or quality decline of their products and advance from tactical goals (short-term goals) to strategic goals (long-term goals).
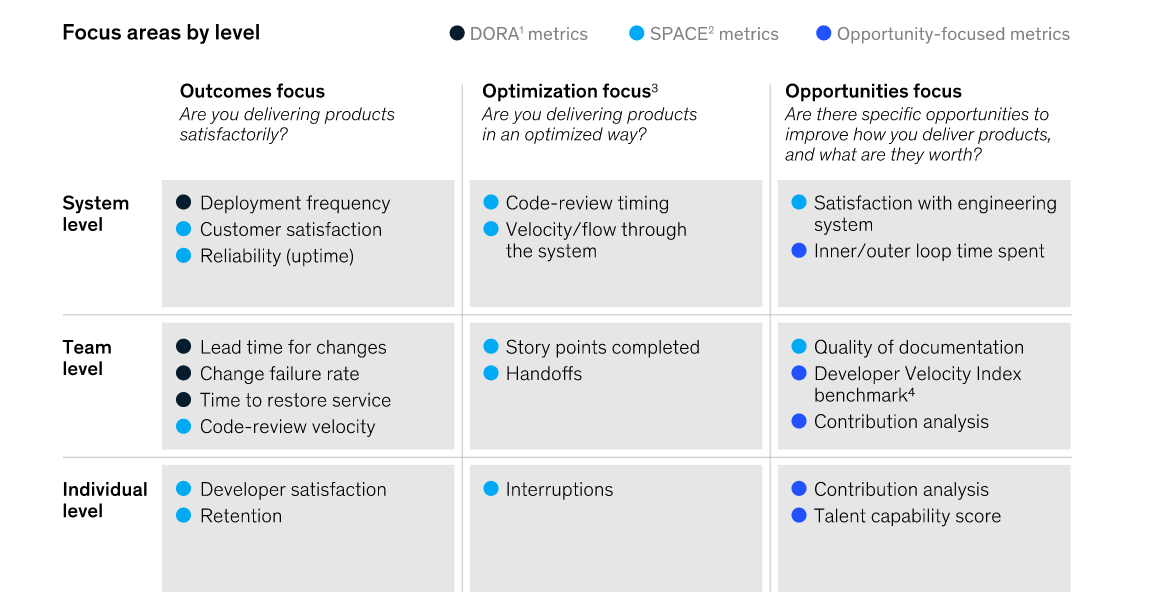
Also related to Agile practices for project management, looking at the KPIs and metrics in the software development, a study at McKinsey has built an approach to handle software projects in a successful way by leveraging existing metrics on the market developed by Google DevOps research and assessment teams (DORA metrics) and GitHub with Microsoft research teams (SPACE metrics).
The DORA metrics are referring to the 4 initial metrics published in 2020, with a 5th metric added in 2021 (Portman, 2020):
- deployment frequency referring to how often an organization releases to production successfully;
- lead time for changes – the time taken for a commit (core building blocks) to reach production;
- change to failure rate – the percentage of deployments leading to a failure in production;
- time to restore service – time taken to recover from a failure in production;
- reliability – probability that a system performs correctly for a given period of time.
The SPACE metrics concentrate not only on the processes and reliability degree of products and systems, but also on the teams’ collaborations and communication, creating an eco-system for the software projects, where there is not just a single metric to capture the success of projects or developers, but a collection of metrics.
The framework has the following metrics and dimensions:
- satisfaction and well-being refers to the degree of how fulfilled, happy and healthy the developers feel with their work, tools, processes and organizational culture, translating this degree into productivity and predictability for success (Forsgren et al., 2021);
- performance which in this case is hard to quantify since we are referring to human factor, but the priority should be given to outcomes, instead of outputs when creating new products;
- activity is measuring the outputs when performing a new task, it can be associated with number of code reviews, successful tests, continuous integration and deployment actions;
- communication and collaboration which are the basis of any successful team, may not be easy to measure, but the authors suggest to look for indicators such as how quickly the work is integrated, quality of the reviews, speed of onboarding new members, etc;
- efficiency and flow are measuring the progress on a task or product without interruptions or delays. This metric can relate to the activities across different teams, orchestration of deployments, number of handoffs in a process, interruptions.
On top of these metrics, the approach defined by McKinsey is adding insights on ways to improve the products without having to rely on heavy instrumentation, creating an end-to-end perspective on what a successful software project could represent.
One important concept added by this framework is the inner/outer loop time, which is defined by the time spent on inner loop activities such as coding, building and unit testing versus the time spent on outer loop activities such as integration, test integration, releasing and deployment. According to McKinsey’s study, the time for inner loop should be maximized as this would create desirable outcomes for developers, whereas the time spent in the outer loop should be minimized by implementing better tools and automation solutions.
Source of picture: McKinsey 2023
Independently of the project management methodologies, in the recent years the research shows there is an obvious emphasis on shifting the organizational cultures towards more collaborative and cross-functional strategies aimed to bridge the business and technical teams, disrupting the old, inefficient processes based on pushing instead of pulling workflows and creating a systems of KPIs and metrics to establish a wide perspective on the capabilities of organization to create market value for their customers.
Organizations’ management need to align the initiation and execution of projects to strategic objectives and vision, invest in talent, adapt frameworks to the operating environment and always strive to adapt and improve their practices and processes based on feedback in order to reap the benefits of project deliverables. Once organizations are ready to address these challenges, they can use a series of modern multidimensional frameworks to provide them with much needed KPIs and metrics designed to monitor and control a successful project delivery.
References:
- Palumbo, S., Rehberg, B., Li, H. (2024). Software projects don’t have to be late, costly and irrelevant. BCG https://www.bcg.com/publications/2024/software-projects-dont-have-to-be-late-costly-and-irrelevant
- PMI – Pulse of the Profession 2023, Power skills, redefining project success, 14th Edition
- Forth, P., Reichert, T., De Laubier, R. & Chakraborty, S. (2020) Flipping the Odds of Digital Transformation success. BCG https://www.bcg.com/publications/2020/increasing-odds-of-success-in-digital-transformation
- Andriole, S. (2021) 3 Main reasons why big technology projects fail & why many companies should never do them https://www.forbes.com/sites/steveandriole/2021/03/25/3-main-reasons-why-big-technology-projects-fail---why-many-companies-should-just-never-do-them/
- Davies, G., Di Pietro, R. (2022) 10 reasons why large-scale IT projects fail https://www.pwc.com.au/digitalpulse/large-scale-it-project-fail.html
- Garcia, J. (2022) Common pitfalls in transformations
- https://www.mckinsey.com/capabilities/transformation/our-insights/common-pitfalls-in-transformations-a-conversation-with-jon-garcia
- Wu, T., Misra, R.B. (2023) Why big projects fail and how to give yours a better chance of success https://hbr.org/2023/11/why-big-projects-fail-and-how-to-give-yours-a-better-chance-of-success
- Scrum.org. (2024) Evidence based management guide https://www.scrum.org/resources/evidence-based-management
- Portman, D. (2020) Google: Are you an elite DevOps performer? https://cloud.google.com/blog/products/devops-sre/using-the-four-keys-to-measure-your-devops-performance
- Forsgren, N., Storey, M.A., Maddila, C., Zimmermann, T., Houck, B., Buttler, J. (2021) The SPACE of developer productivity, there’s more to it than you think, Software Development, Vol. 19. No.1

